Business Intelligence
Cloud-based report automation with Power BI
Our team of Business Intelligence experts will integrate your data from multiple sources, connect the entire analytics ecosystem, deliver detailed insights faster, and streamline decision-making using Microsoft Power BI.
Our goal is to ensure that you can run your business in the most efficient way and easily identify opportunities for optimization and growth.
Award-winning experts, leading technology, financial & business background
We are a team of experts with years of experience in integrating, processing, and designing actionable BI-class business & operational reports.
Having worked with Entrepreneurs, Boards of Directors and C-Level Executives for many years and leveraging our experience in finance and strategic consulting, we have developed a deep expertise in understanding business needs and transforming them into meaningful reporting solutions.
We use Power BI – a technology that for the 15 consecutive years has been positioned as a Leader in the Gartner Magic Quadrant for Analytics and Business Intelligence Platforms.
We are a proud official partner of analytics technology providers

Our values
Cutting-edge technology
Leveraging the fastest growing, stable and secure technology solution
Flexibility & Scalability
Tailoring solutions to your needs which may evolve over time
Financial background
We understand the business, financial processes and controlling needs
Trendsetters
So highly valued that we give training & tips to external BI developers
Benefits
The benefits of implementing and using well-designed business intelligence solutions are undeniable. That’s why modern business analytics is one of the key pillars of enterprises’ digital transformation.
Single source of truth

Single source of truth
Data-driven decision making has placed never-before-seen levels of importance on collecting and analyzing data.
Instead of debating which of many competing data sources should be used for making company decisions, with solutions such as Power BI everyone can use the same, unified source for all their data needs, in any way, across the entire organization.
Data-empowered leaders & teams

Data-empowered leaders & teams
To fully unleash the value derived from business data, it must be made available to data consumers throughout the organization in order to empower them to find and use this data.
Business Intelligence solutions make it possible to share selected areas of data within an organization in a secure manner. As a result access to business data is democratized in an intelligent way, and your teams can make better and more effective business decisions. It’s more than just making data accessible.
Automation & integration

Automation & integration
Business Intelligence isn’t just about dashboards, fancy charts, eye-catching visualizations. It is a much more complex process that begins with the collection and processing of raw data and results in the effective delivery of valuable knowledge.
Leveraging our expertise and technologies such as Microsoft Power Platform it is possible to automate the collection, flow and processing of data. Automated processes will save you time, complex data will no longer be a challenge, human error will not be an issue anymore.
Faster analysis, intuitive reports

Faster analysis, intuitive reports
Business intelligence solutions such as Power BI allow quick access to such data as we need at any given moment. The insightful reports we create are fully interactive, allowing you to drill down gradually into the details, filtering the data depending on the view you need at the time.
Microsoft is passionate about making Power BI quick and easy for report users to use so that customers have the experience of “five minutes to WOW!” with Power BI. With the right BI solution in place, you can get actionable business insights in just a few clicks.
Single source of truth
Data-driven decision making has placed never-before-seen levels of importance on collecting and analyzing data.
Instead of debating which of many competing data sources should be used for making company decisions, with solutions such as Power BI everyone can use the same, unified source for all their data needs, in any way, across the entire organization.
Data-empowered leaders & teams
To fully unleash the value derived from business data, it must be made available to data consumers throughout the organization in order to empower them to find and use this data.
Business Intelligence solutions make it possible to share selected areas of data within an organization in a secure manner. As a result access to business data is democratized in an intelligent way, and your teams can make better and more effective business decisions. It’s more than just making data accessible.
Automation & integration
Business Intelligence isn’t just about dashboards, fancy charts, eye-catching visualizations. It is a much more complex process that begins with the collection and processing of raw data and results in the effective delivery of valuable knowledge.
Leveraging our expertise and technologies such as Microsoft Power Platform it is possible to automate the collection, flow and processing of data. Automated processes will save you time, complex data will no longer be a challenge, human error will not be an issue anymore.
Faster analysis, intuitive reports
Business intelligence solutions such as Power BI allow quick access to such data as we need at any given moment. The insightful reports we create are fully interactive, allowing you to drill down gradually into the details, filtering the data depending on the view you need at the time.
Microsoft is passionate about making Power BI quick and easy for report users to use so that customers have the experience of “five minutes to WOW!” with Power BI. With the right BI solution in place, you can get actionable business insights in just a few clicks.
Make insights-driven decisions faster with Power BI
Our offer
We are flexible, adapting our activities to the individual needs of the organization and the requirements of business analytics.
Our experts can address the entire lifecycle of your BI reporting ecosystem comprehensively, as well as support you only on a selected phase – from feasibility check, through designing stunning reports to post-implementation SLA.
1
BI Planning and consultation
- Business perspective needs
- Source data analysis
- Feasibility check
- Review of accounting procedures
- Data culture assessment
- Proof of Concept
2
Data preparation
- Accounting procedures
- Data structuring
- Supporting tools implementation
- Optimization of existing databases
- Data migration to the cloud
- Cleaning & transforming data
3
Integrations and automation
- Setting up built-in data connectors
- Creation of new data connectors
- Integration of data from multiple sources
- Data schema mapping
- Automation of data flow and processing
- Reducing the number of spreadsheets
4
Designing reports
- Management dashboards
- Analytical dashboards
- IBCS®-compliant visualizations
- Advanced measures and algorithms
- Simulations & scenario-based analysis
- Training on how to use BI reports
5
QA, Support & Development
- Outsourcing of necessary manual processes
- Monitoring of automated solutions
- Development of the whole reporting ecosystem
- Customizing dashboards to meet evolving needs
- Training for new users
- Hotline / SLA support
The process
We will manage the process from A to Z, tailoring the next steps to your capabilities and goals.
Free online consultation
Make an appointment for a no-obligation call to tell us about your needs, capabilities, level of current business analytics, systems and applications you use. We will initially tell you how we can address your challenges and whether the solutions we offer will meet them.
Feasibility check
We will conduct an initial feasibility check to ascertain that Power BI technologies are in full compliance with your analytical or managerial needs, time, and technical constraints.
Implementation plan
Together we plan further activities to achieve a satisfactory result within the specified budget and schedule. We can apply incremental implementation for you to get value early or deal with the case from the beginning comprehensively, clearly setting goals.
Data preparation
We recommend specific changes to data sources (including accounting data) and, where possible, automate their collection, processing and integration. For ancillary data stored in spreadsheets, we assist in creating appropriate secure repositories.
Report creation
Based on the created reporting back-end, we develop amazing dashboards that will be characterized by clarity, intuitiveness and usability. On top of that, with data from various sources in one place, you won’t have to look anywhere else for actionable insights.
Development & associated services
Where others end, we continue our work. We help to develop reporting ecosystems and ensure their high quality, but that’s not all. With us on board as a true business partner, you can always benefit from our controlling, financial or strategic expertise.
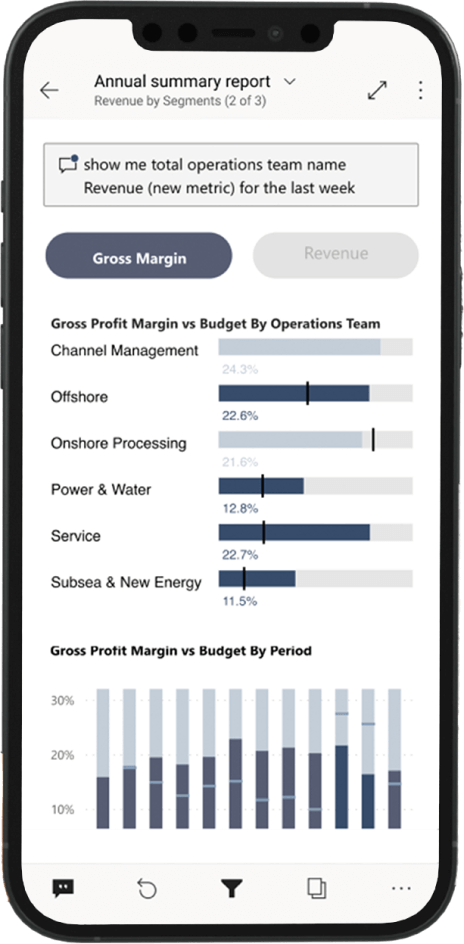
Anytime, anywhere, any device. Literally.
Access all your dashboard’s data with your browser, desktop app or mobile app and get alerted for noteworthy change in performance.
Application available at:
We work transparently and we care about your trust
In case it’s your first time dealing with business intelligence solutions, please read the answers to questions that often arise at the beginning of the journey. If you have any additional questions, don’t hesitate to reach out to us.
Why should I opt for Power BI and not another technology solution?
Power BI is a cloud-based BI service that was released by Microsoft in 2014. It leverages years of experience in MS Excel, SQL Server, Access and continually, and for good reason, is indicated as a top#1 BI solution in numerous market reports.
One of the most important advantages of Power BI is that it is able to pull data from almost any source – not just a selected data ecosystem or technology. In addition, it is relatively easy to use from the user side of reports and allows them to be shaped quite freely for the business or operational needs of the organization.
It also allows you to share selected reports or sections of reports with other users, so your entire organization can be data-driven without compromising the security of your data.
And last but not least, it is highly cost-effective – both in terms of implementation and subsequent maintenance.
How do I know my information is secure?
Our team has an information security policy with appropriate IT monitoring, and our teams are well-equipped to use technology and tools for sensitive information.
In addition, with our services we improve the security of your organization’s data and information by reducing the number of files or emails sent electronically to a total minimum using secure technology equipped with multi-step authentication.
All data captured in Power BI is encrypted by default using Microsoft-managed keys. Customer data stored in Azure SQL databases is fully encrypted using Azure SQL Transparent Data Encryption (TDE) . Customer data stored in Azure BLOB Storage is encrypted using Azure Storage Encryption. The Power BI Premium license additionally allows you to use custom keys to encrypt stored data that is imported into the data store.
Why do I even need BI-class reporting? We have an ERP system and probably sufficient reports in Excel spreadsheets.
That’s what many managers think until they see in practice how useful, fast and accessible their reports can be using business intelligence technology.
This is due to the great ease with which they can get the information they need at any given time, at any level of detail – often with just a few mouse clicks or finger taps on a smartphone screen.
However, BI isn’t just about the front-end, it’s also about everything that goes on in the background – which means automating the collection, combination and processing of data. Consider how much time you and your team will save in creating analytical reports, summaries and analyzing them by paying off your technology debt in the reporting & analytics area.
Is it expensive to implement and maintain a business intelligence reporting ecosystem based on Power BI?
The Power BI solution is highly cost-effective. The cost of maintaining the solution itself depends mainly on the number of users of the target reports. The cost of a license for 1 user is $10-20/month (depending on the level of complexity of the reporting back-end).
On top of that, of course, there is the one-time cost of implementation, i.e. the overall design of the report architecture, data model and user interface. However, the development work and thus the cost can be spread over time. This part of the cost is a function of the company’s reporting and analytical needs, the level of complexity of the business model and data structures. However, thanks to the flexibility of the technology behind Power BI and affordable integrability with external systems and databases, the implementation costs are not comparable to the deployment of complex systems such as ERP, xP&A or EPM/CPM.
Once BI-class reporting is implemented, do I need to hire experts to maintain and grow this ecosystem?
You don’t need to increase employment. Who knows, you may even find that you can optimize your current resources. A correct BI implementation is most often combined with the automation of a significant part of analytical and reporting processes. This way your team won’t have to waste time unproductively transferring data from one spreadsheet to another.
We often enter into a partnership with our clients after a period of fundamental implementation, helping them gradually develop and optimize their reports, respond to new analytical and managerial needs, provide continuous QA and optimize further processes.
Exploiting our extensive experience in finance and strategy, we also provide synergistic consulting services, including ongoing financial controlling. You then have your comprehensive analytical needs provided under one roof.
Do I need a data warehouse to implement a business intelligence solution?
Not necessarily. It all depends, of course, on individual needs and where the data is currently being processed. Data from sources (e.g., your accounting system, ERP, CRM, workflow applications, spreadsheets) can feed the BI reporting ecosystem directly, without going through a big data warehouse. If you decide you need one, however, or if it would simply be more efficient for whatever reason, you can start by using so-called Datamarts, which are relatively low-cost data storages, based on the Azure SQL cloud.
Of course, we can help you on both simplified data flow and slightly more complex data warehousing solutions. However, this does not mean an exponential increase in the cost of deployment – today, these are effective solutions whose cost of maintenance increases as the volume of data increases.
Take a look at the results of our work
IT / Software house / Gamedev
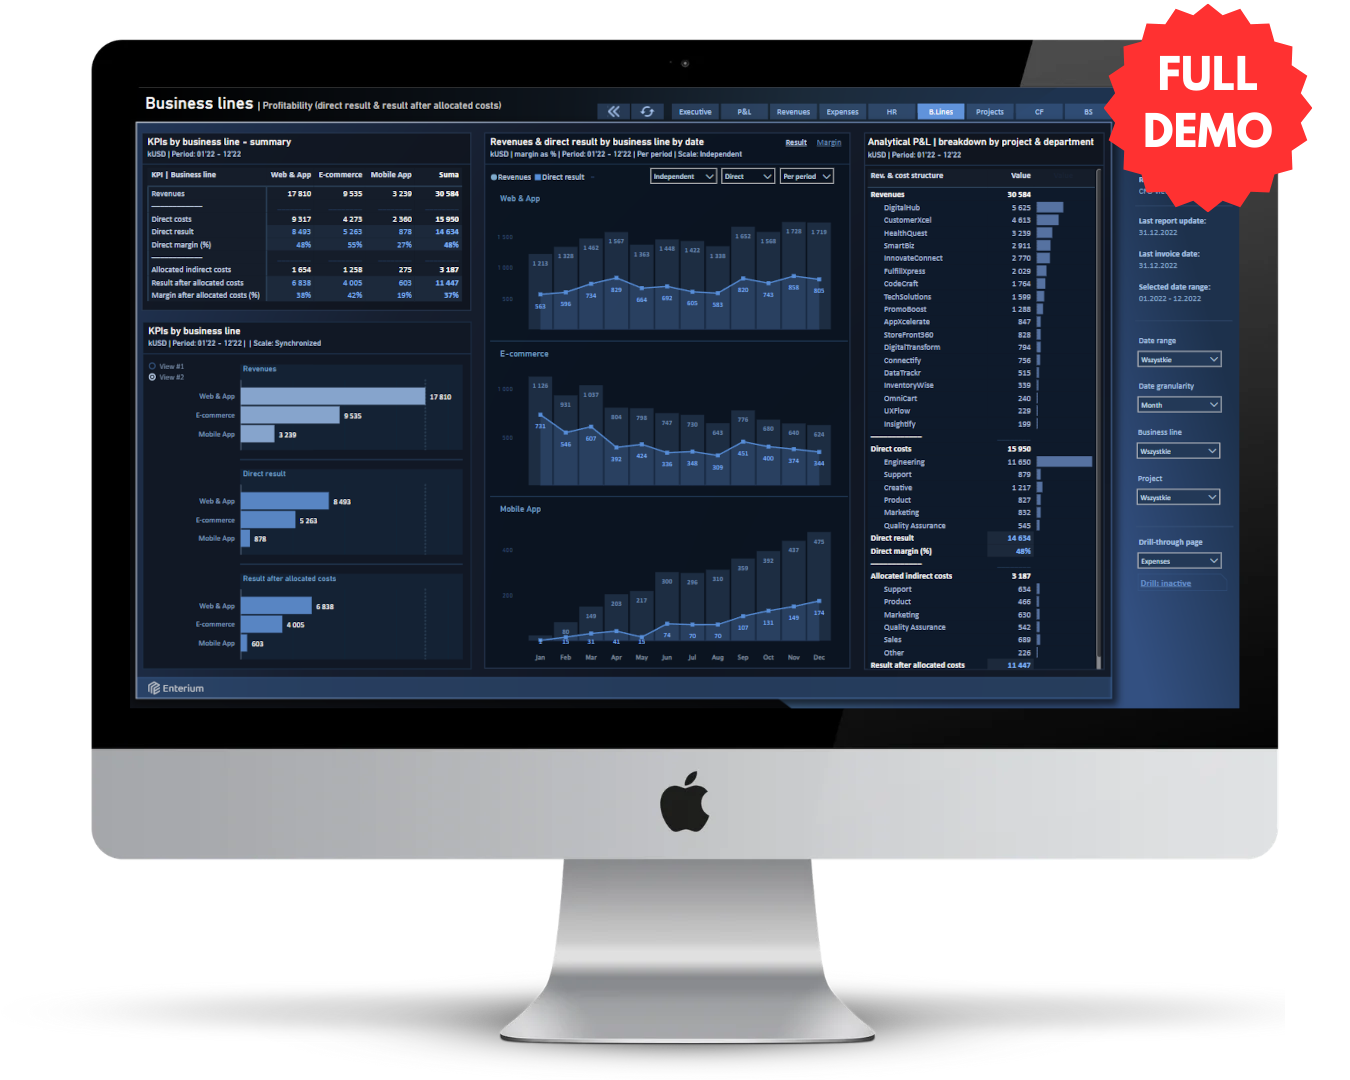
Full BI report demo for IT businesses
A set of dashboards with executive summary, revenue and cost analysis, HR module, business lines and projects margin, cash flow management and budget variance analysis.
Multidimensional KPI analysis
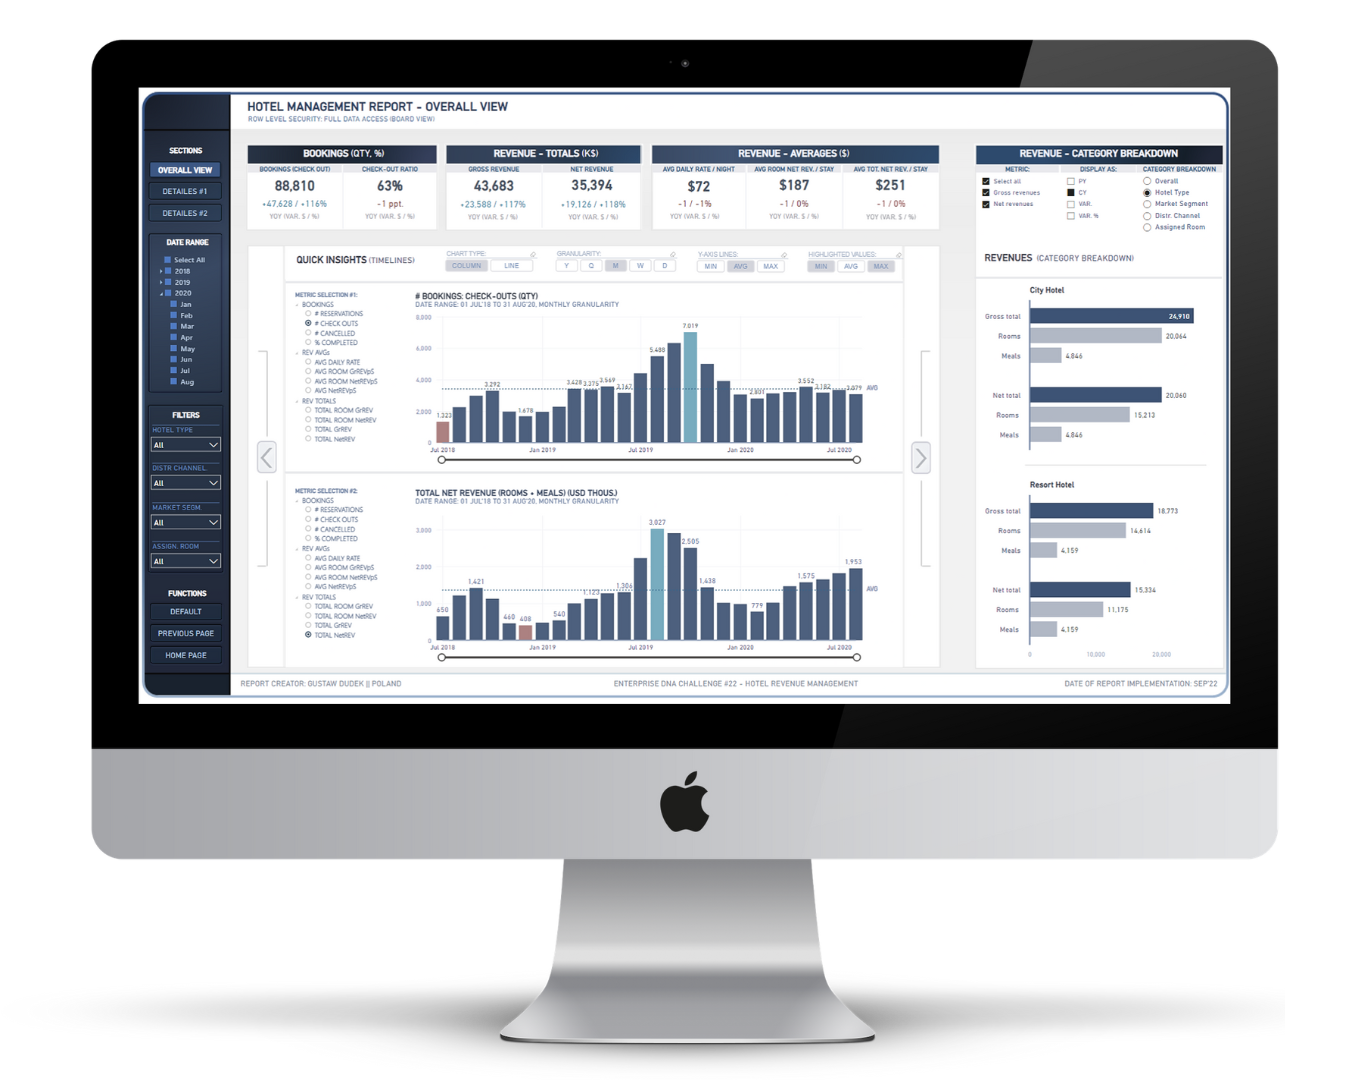
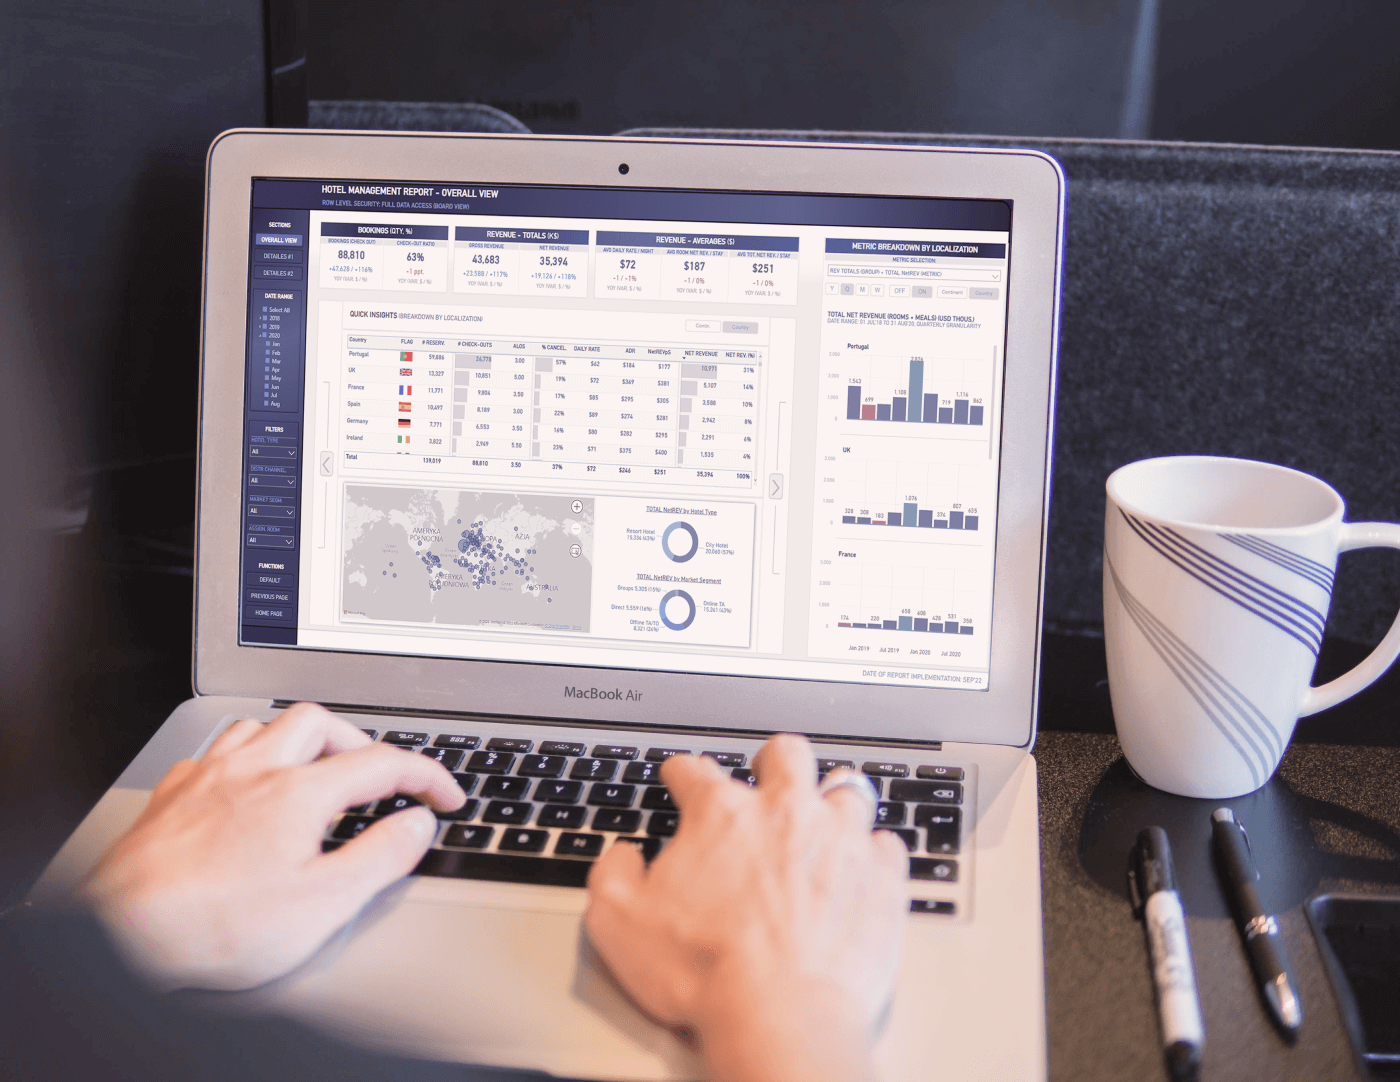
KPI analytics on the example of a hotel company
A set of dashboards for a service company in need of real-time insight into certain industry-specific KPIs, illustrated by the example of a company running a hotel chain.
Marketing reach analysis
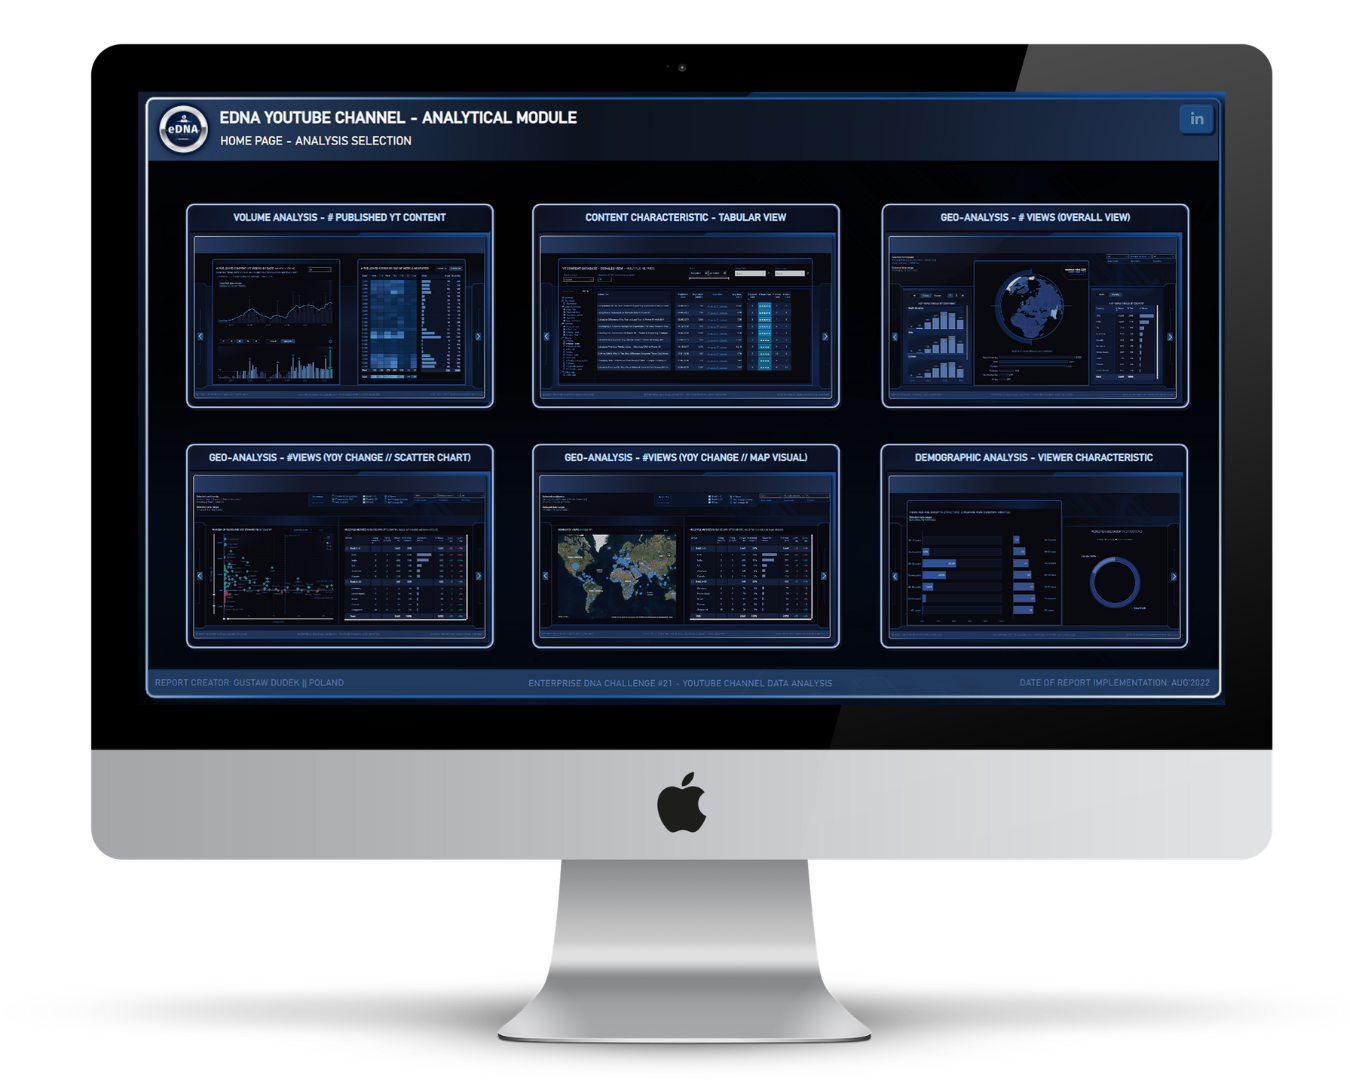
Marketing reach analytics using video content as an example
A sample set of dashboards that allow intuitive tracking and analysis of the audience structure of specific marketing campaigns or content production over time (including even hours).
Market intelligence
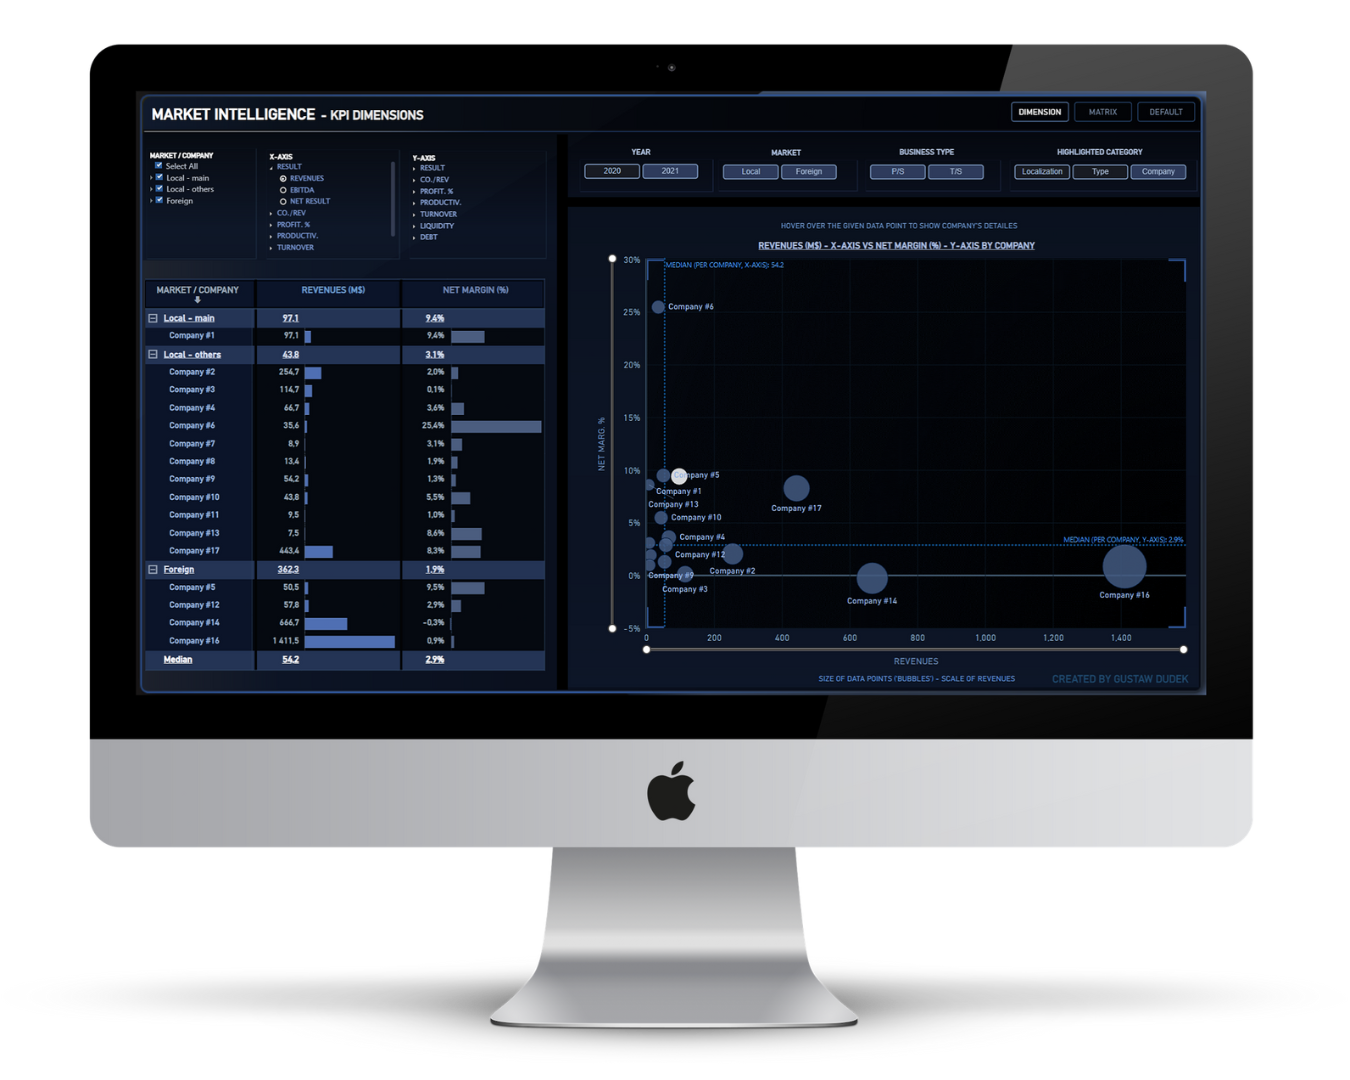
Competitive benchmarking report
A report that provides market intelligence through benchmarking of a company’s financial performance and KPIs to its competitors, in multiple cross sections with the ability to filter in various ways.
Financial KPIs
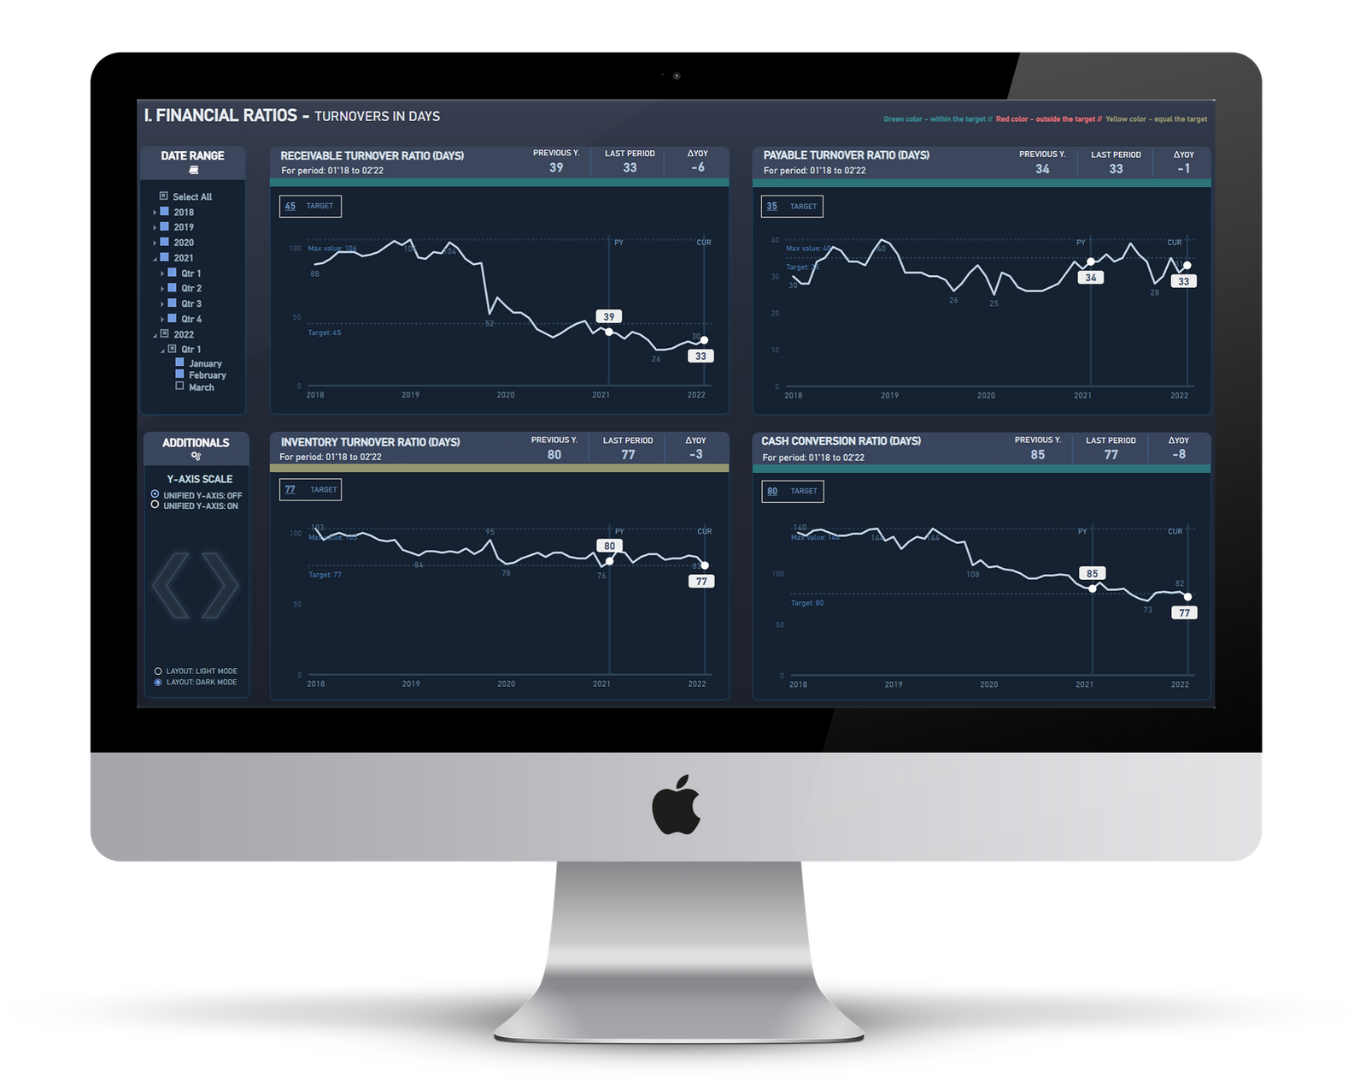
KPI monitoring with reference to targets
A relatively simple report showing the level of performance indicators achieved. At the same time, the dashboard demonstrates the possibilities for visual customization of dashboards and dynamic application of benchmarks.
CRM analytical report
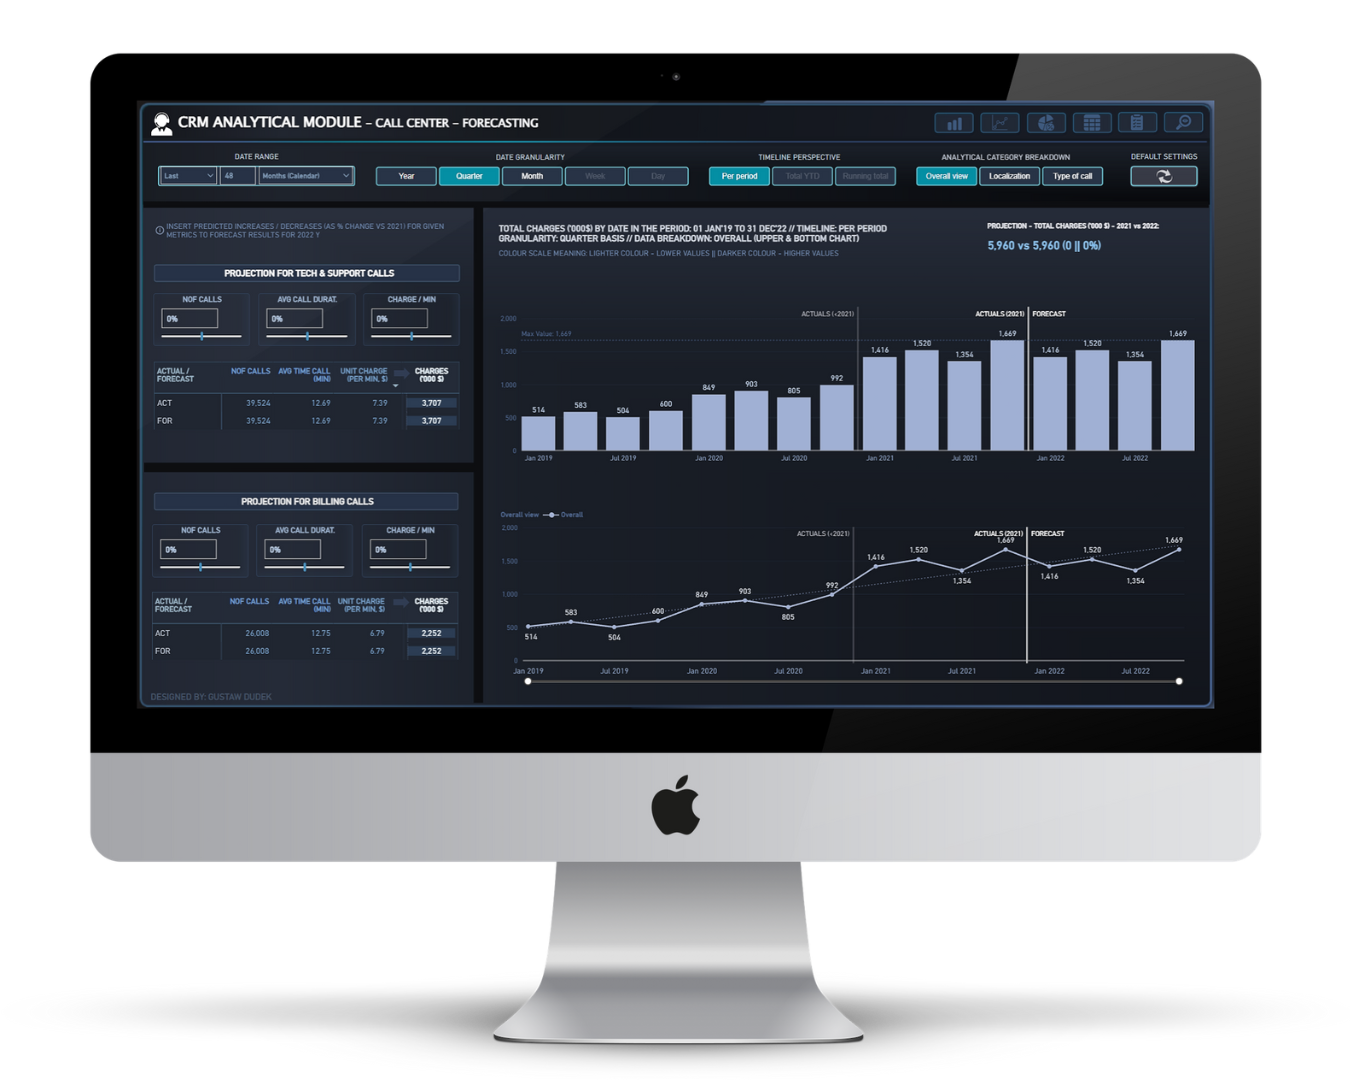
CRM-based analysis of call center activity
Analytical report that allows multidimensional analysis of detailed data on the activity and effectiveness of the sales team / customer care (call / contact center). It illustrates the ability to analyze relatively complex structures and conduct quick forecasts in Power BI.
Emergency services analysis
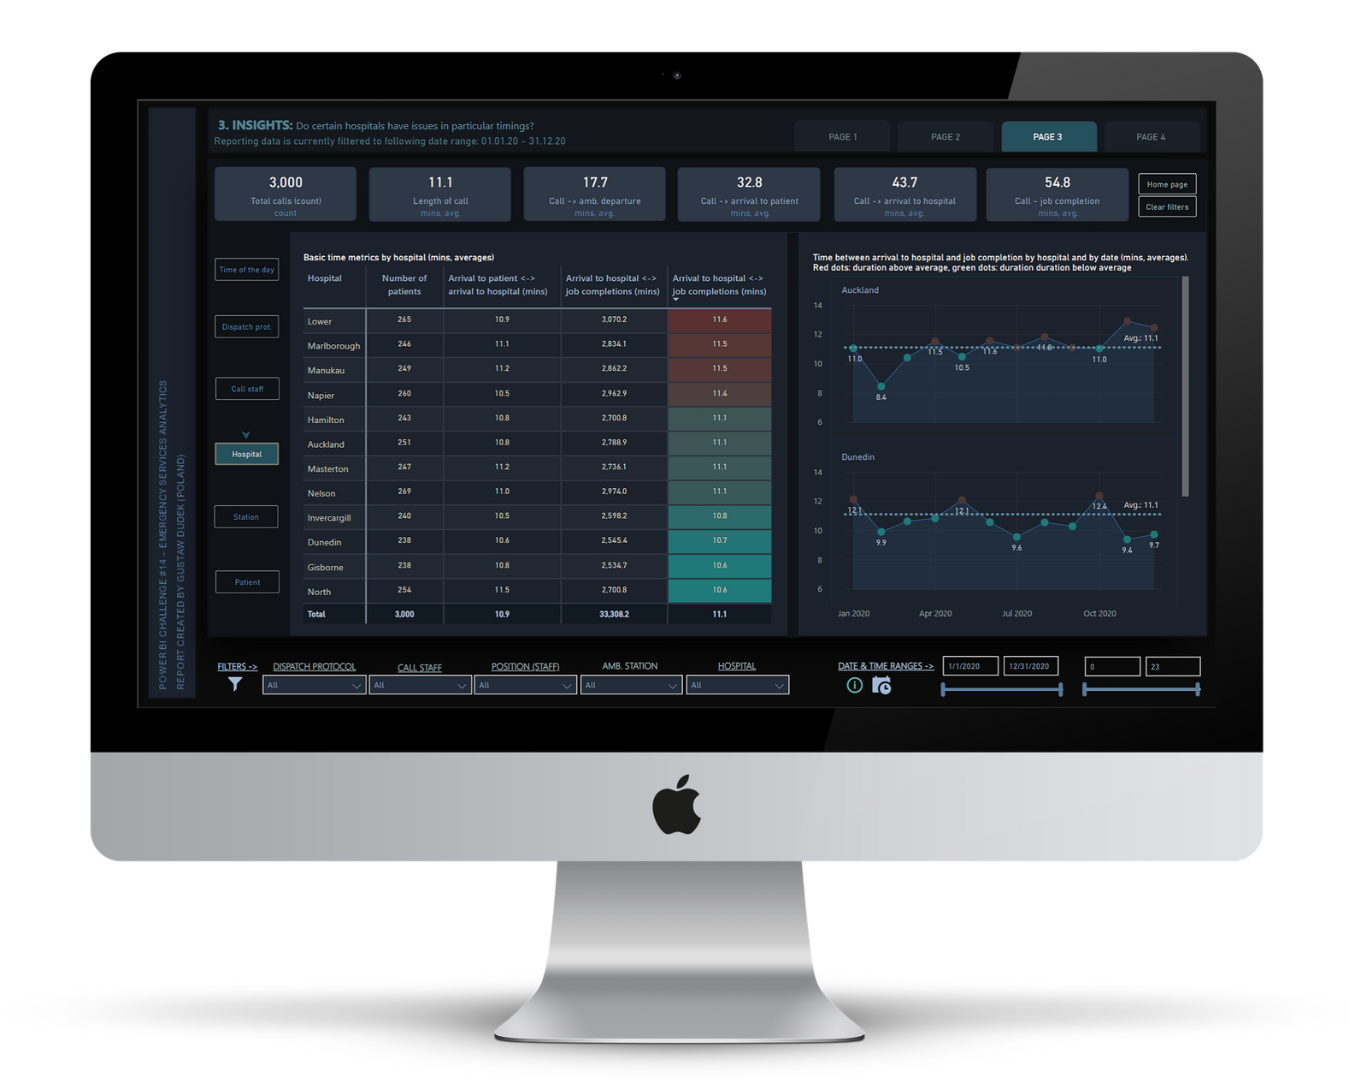
Report for emergency services company
Quite a specialized set of dashboards that allow detailed analysis of emergency medical team activity. The report uses a variety of inspiring methods to visualize operational data.
B2B services profitability
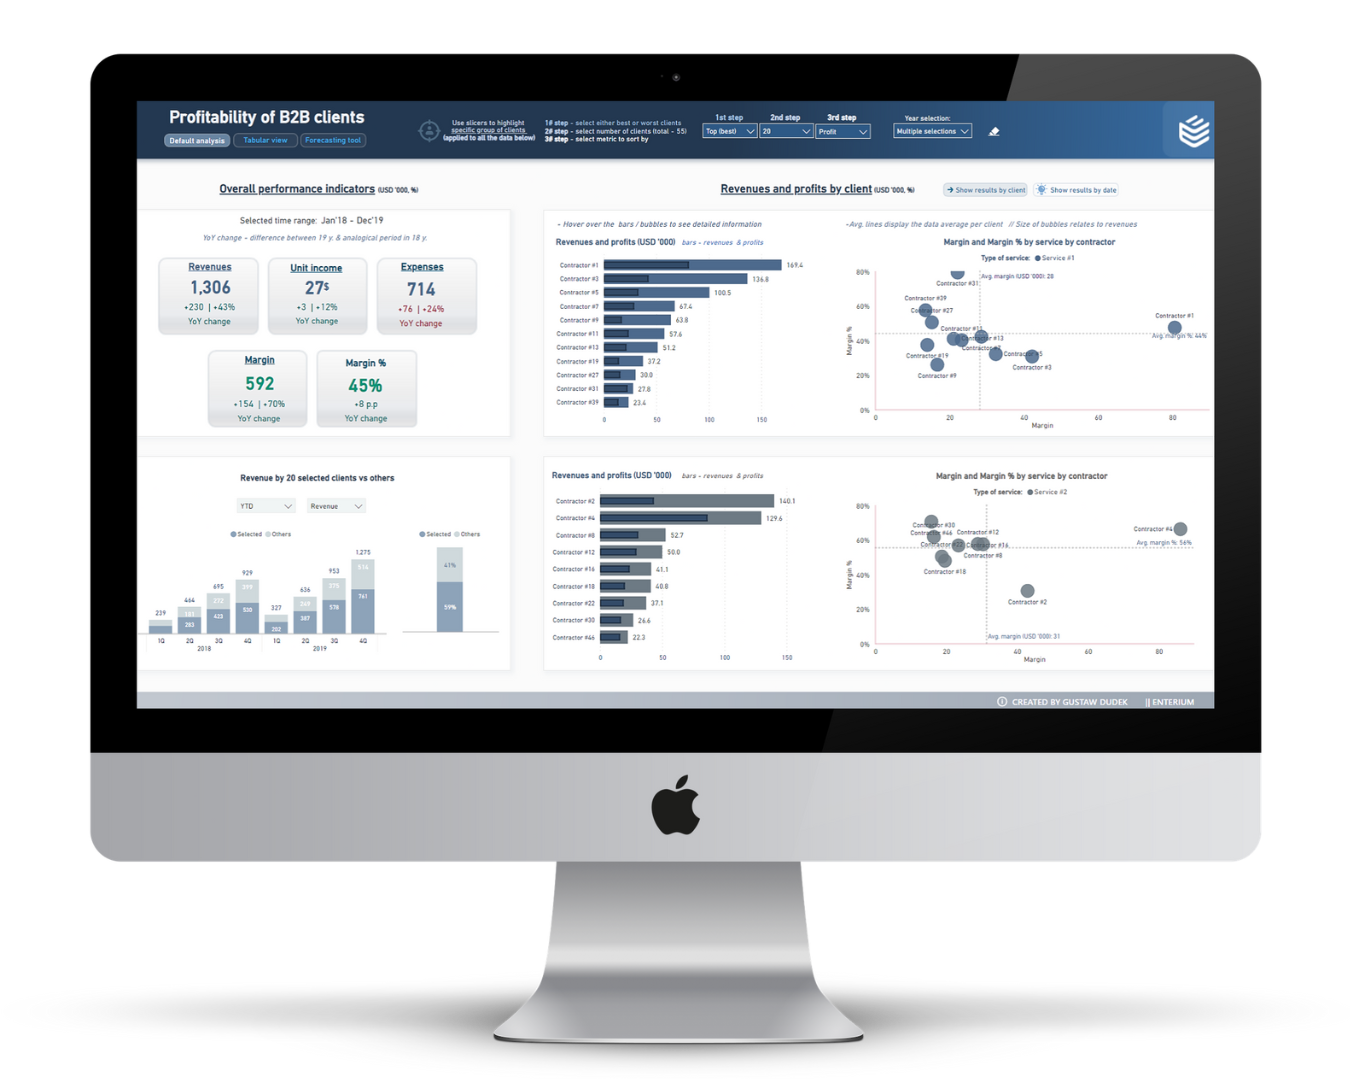
Analytical report on the profitability of providing b2b services
An example of a report that allows comparing the profitability of providing certain business services to customers, with the ability to benchmark and rank them. At the same time, the dashboards allow for quick scenario analysis.
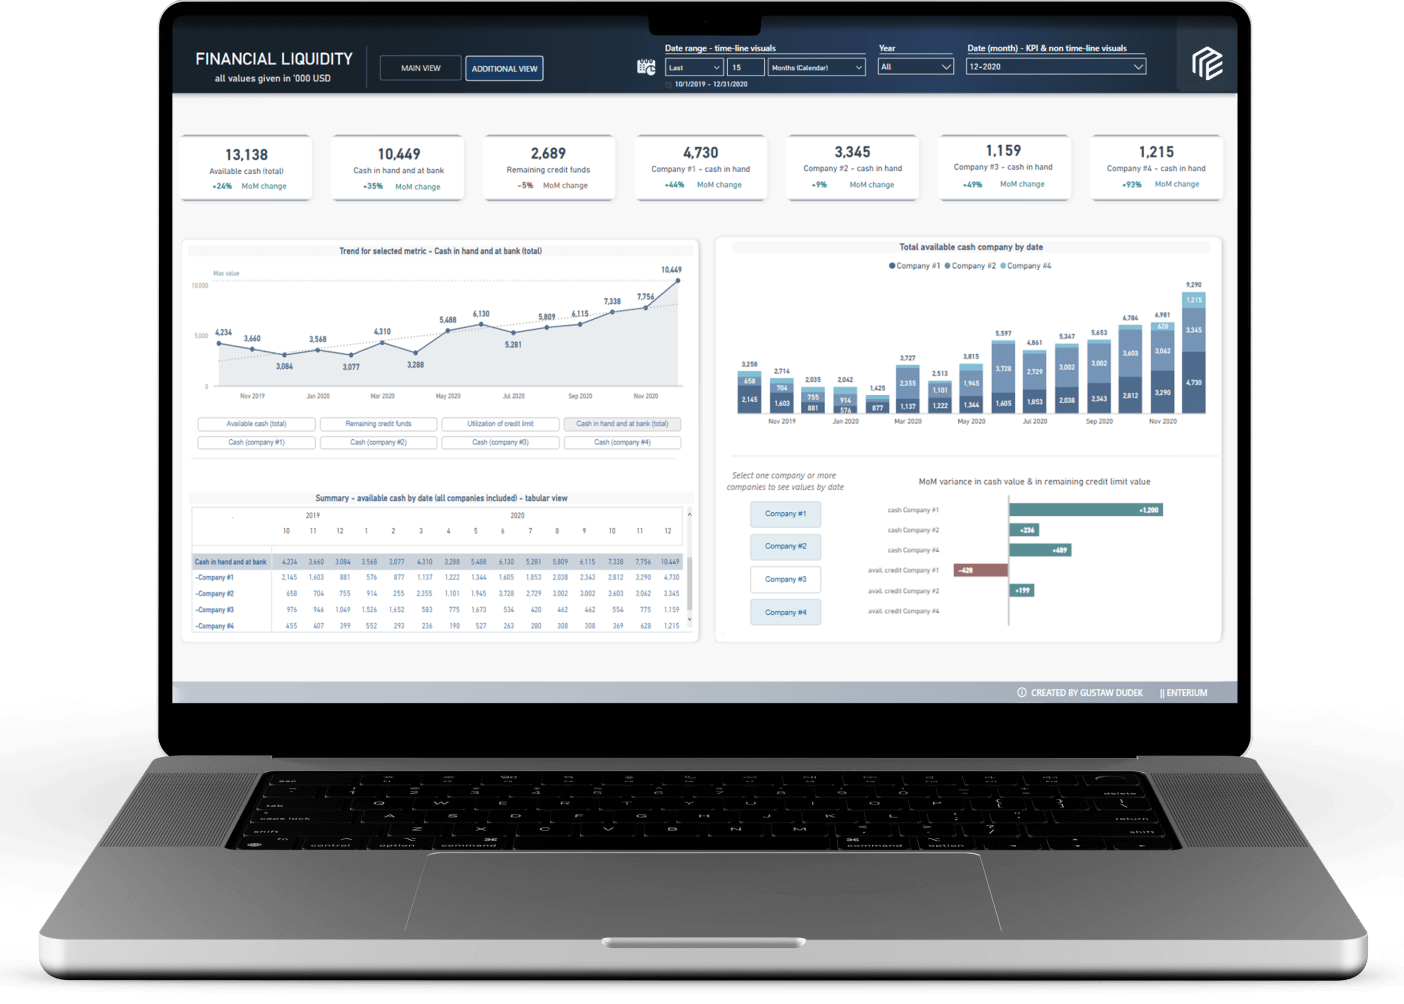
Financial liquidity
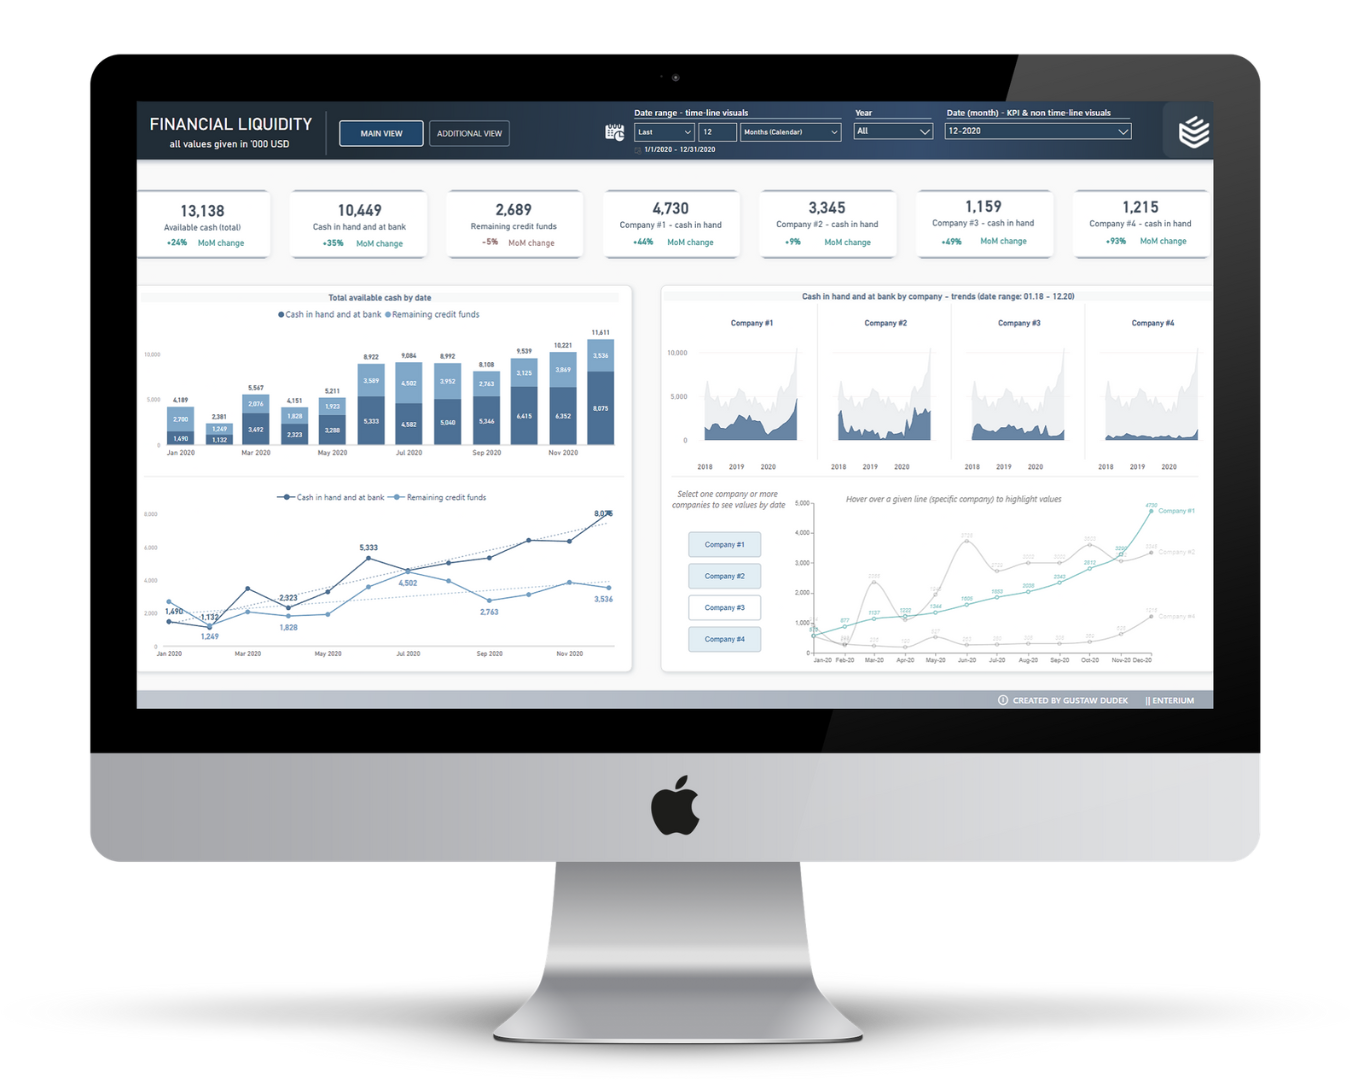
Cash position analytical report
The report allows the company’s cash position to be analyzed on an ongoing basis, along with an illustration of the debt structure and changes in wealth over time. In addition, the report shows how you can freely select the measure to be visualized on the chart.
Full BI report demo for IT businesses
A set of dashboards with executive summary, revenue and cost analysis, HR module, business lines and projects margin, cash flow management and budget variance analysis.
KPI analytics on the example of a hotel company
A set of dashboards for a service company in need of real-time insight into certain industry-specific KPIs, illustrated by the example of a company running a hotel chain.
Marketing reach analytics using video content as an example
A sample set of dashboards that allow intuitive tracking and analysis of the audience structure of specific marketing campaigns or content production over time (including even hours).
Competitive benchmarking report
A report that provides market intelligence through benchmarking of a company’s financial performance and KPIs to its competitors, in multiple cross sections with the ability to filter in various ways.
KPI monitoring with reference to targets
A relatively simple report showing the level of performance indicators achieved. At the same time, the dashboard demonstrates the possibilities for visual customization of dashboards and dynamic application of benchmarks.
CRM-based analysis of call center activity
Analytical report that allows multidimensional analysis of detailed data on the activity and effectiveness of the sales team / customer care (call / contact center). It illustrates the ability to analyze relatively complex structures and conduct quick forecasts in Power BI.
Report for emergency services company
Quite a specialized set of dashboards that allow detailed analysis of emergency medical team activity. The report uses a variety of inspiring methods to visualize operational data.
Analytical report on the profitability of providing b2b services
An example of a report that allows comparing the profitability of providing certain business services to customers, with the ability to benchmark and rank them. At the same time, the dashboards allow for quick scenario analysis.
Cash position analytical report
The report allows the company’s cash position to be analyzed on an ongoing basis, along with an illustration of the debt structure and changes in wealth over time. In addition, the report shows how you can freely select the measure to be visualized on the chart.